
Those of you with a keen eye may have noticed new tabs appearing on OceanWise’s Environmental Data Sharing and Publishing platform, Port-Log.net. We have been working hard to improve the way wave data is processed and displayed. New graphics include directional and non-directional wave spectra, as well as time series and tabular displays of key parameters, such as wave height and period. A choice of displays support operational, scientific and engineering applications and have been thoroughly tested in the field by users.
Behind the scenes our technical team has collaborated with Icon Software to include real-time computation of wave spectra from raw sensor data and the partitioning of spectra into Wind Sea and Swell. Icon’s algorithms are widely adopted by the oil & gas sector and are the industry standard. Theoretical spectra can be fitted to the total and partitioned spectra to compute JONSWAP parameters e.g. gamma, which provide essential input to operational planning and engineering design.
Port-Log’s Advanced Wave Processing extension is available to all existing and new Port-Log users via an additional subscription fee.
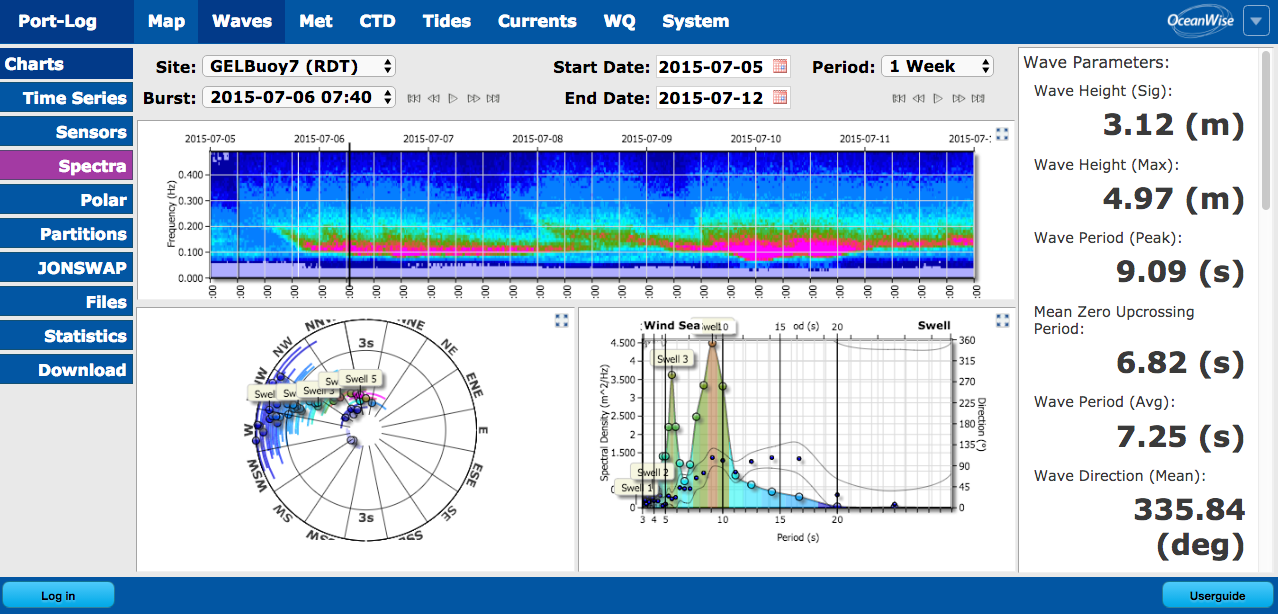
Directional Wave Spectra processed and presented on Port-Log,net
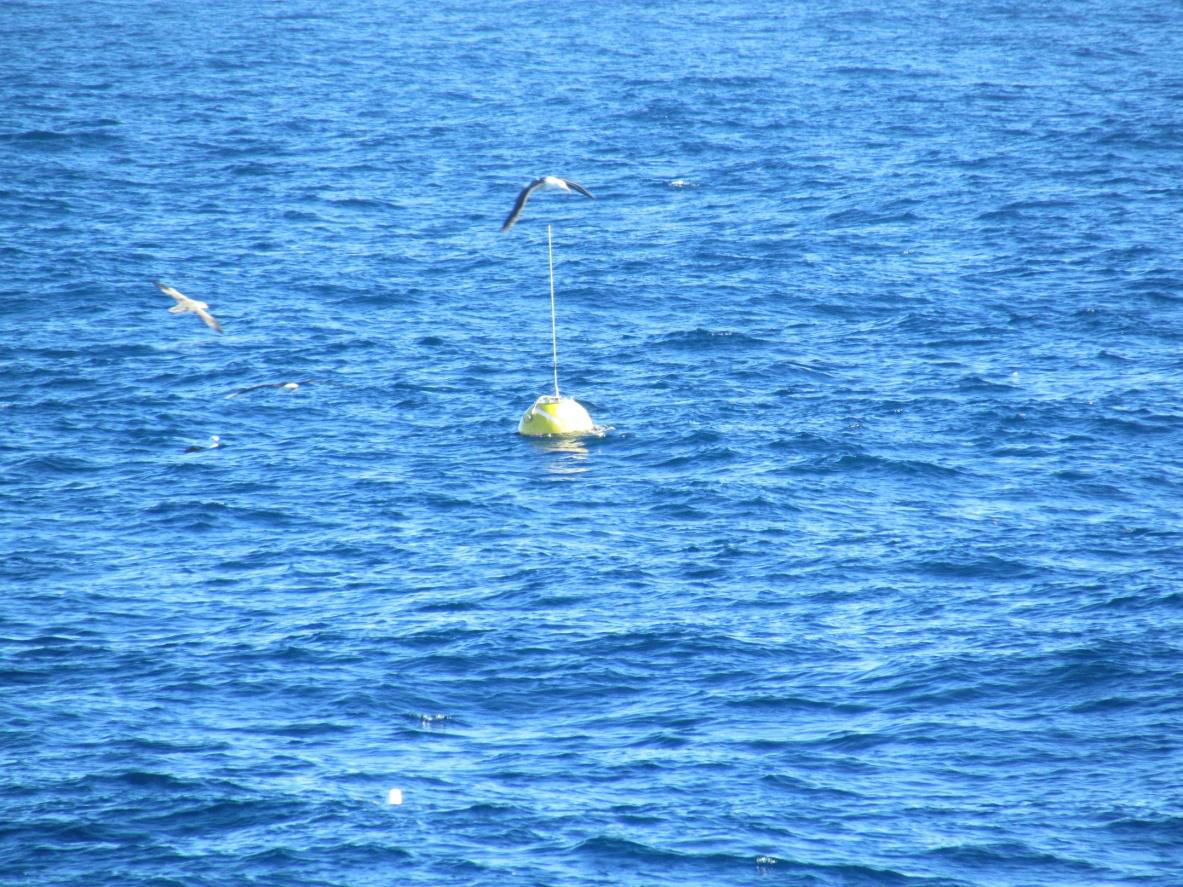
Datawell Wave Buoy, Falkland Islands (Source: Premier Oil)